
By Lizzy LeRud
In my first few years of teaching poetry, I quickly grew to expect my students’ slightly sick expressions when words like “iamb” and “trochee” came up in class. Many students were weary from memorizing these Greek words for poetic meters, a necessary task for getting by in high school English or to pass an AP exam. Perhaps they retained the basic idea—that these terms denote simple patterns of stressed syllables. Many students recalled a set of symbols they had learned for marking such patterns or “scanning” a poem, perhaps like the example shown below, which demonstrates a typical way of marking the stressed syllables in Lucille Clifton’s poem, “homage to my hips”:
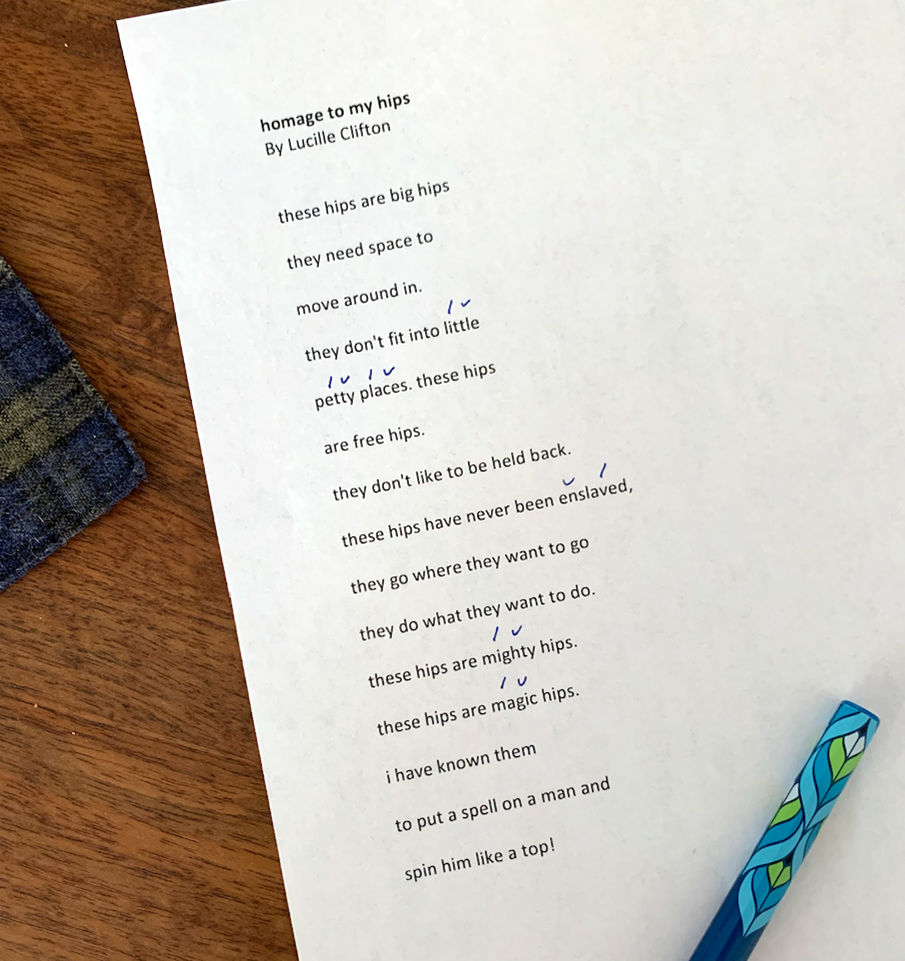
A dash and u-shaped marking are often used to denote stressed and unstressed syllables, respectively.
But few students enter college knowing why this system, “scansion,” was designed in the first place. Few know that it works because English is a stress-timed language, and it doesn’t work the same way for, say, Japanese or French, which are mora-timed and syllable-timed, respectively. They had not learned that in a stress-timed language, a listener’s comprehension of multisyllabic words depends on a speaker’s pronunciation; stresses occur differently in mora- and syllable-timed languages. Most English speakers say suc-CESS and CIR-cuit; SUC-cess and cir-CUIT are practically different words.
But while few of my first-year students start out knowing why this system works, almost everyone has some idea of its imperfections. They had noticed all those single-syllable words—like “hips”—which are never consistently stressed or unstressed. They had noticed that even so-called “standard” pronunciation varies wildly (for example, is “homage” pronounced “ho-MAGE” or “HO-mage”? In fact, both are pretty common, according to the pronunciation guide in the Oxford English Dictionary). Or perhaps they noticed that this binary system, stressed or unstressed, is really quite rudimentary; natural speech is never so simple. In fact, an iamb is not a stable, essential unit of English speech, as linguists have long observed.
I believe that poetry teachers have done students a great disservice by teaching this system without helping students explore these flaws. Why teach a flawed system? Because despite its flaws, it has helped poets write some absolutely stunning poems. But it is the flaws themselves that concern me here. For students taking my English courses at Georgia Tech, these flaws are a chance for thinking critically about the “V” for “visual” in Tech’s signature multimodal “WOVEN” approach.
Scansion is essentially a method for data visualization, just like a map or a pie chart; it’s a graphical representation of the phonemic data that a poetry scholar locates within a poet’s words. In fact, it’s arguably the most famous data viz system in English literature today. The fact that we don’t think of scansion as data visualization—but that students are so ready, even eager, to critique it—makes it an ideal teaching opportunity. Pairing scansion with other, more recently developed methods of computerized poetry analysis, I guide students to think beyond data output (all those iambs and trochees, say) and consider how data emerges, turning their eagerness to critique scansion into a general critique of graphic representations of data. Ultimately, teaching poetry analysis within a data visualization framework instills in students a widely applicable lesson: that how we gather and represent data is integrally related to how we interpret it.
Poetry and Big Data
In our age of “big data,” characterized by internet systems that gather way more information than we can easily process, we tend to associate data visualization with computers. Automated software can process large amounts of data faster and more efficiently than ever before. Georgia Tech’s Data Visualization Lab, centered on its signature giant screen, reinforces this association.
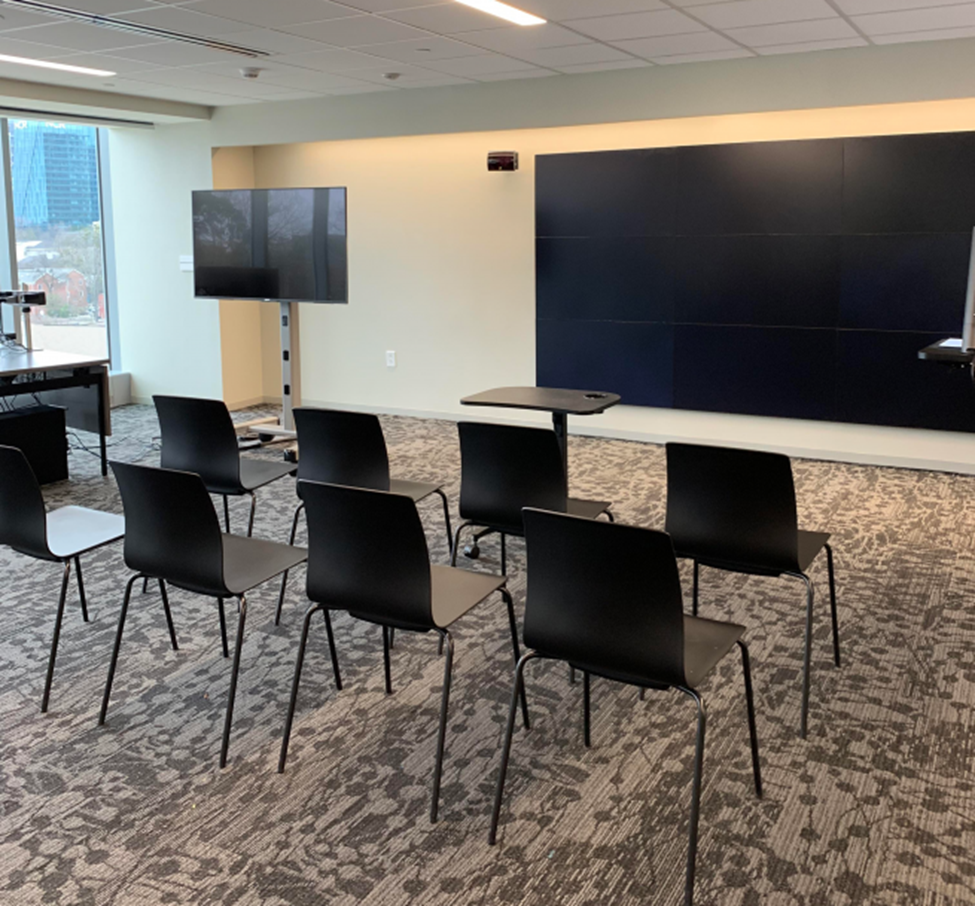
Tech’s Data Viz Lab, featuring its large-format screen display on the right.
The tools of big data have proven useful to poetry scholars. Starting in the 1980s and 1990s, some began to explore ways of writing software to track quantifiable patterns in poems, especially syllabic rhythms (for more on the long history of poetry analysis software, check out Setsuko Yokoyama’s fascinating article, “Digital Technologies for Exploring Prosody: A Brief Historical Overview”). Partnering with Tech’s Data Visualization Lab this spring, I’ve begun teaching first-year students how to use some of these tools to analyze poetry rhythms.
I’ve focused on methods introduced by Marit MacArthur, who pioneered the use of forced-alignment speech software and pitch-tracking tools for identifying patterns in audio recordings of poems. MacArthur uses Gentle and Drift, two open-source digital tools that align an audio recording with its transcription. Gentle and Drift were developed in 2015 by Robert Ochshorn and Max Hawkins using Kaldi, an open-source speech recognition software toolkit that was developed at Johns Hopkins University. You can read more about MacArthur’s approach here and here. Below, I’ll lay out a quick primer on Gentle and Drift before explaining how I use these tools to help students contextualize scansion and rethink their approach to gathering data.
Using Gentle and Drift to Analyze Poetry: A Primer
Basically, Gentle assesses word timing and tempo, and Drift is a highly sensitive pitch-tracker. The software can be downloaded, but web-based versions of these programs work almost as well, which makes them easy for students to access from their personal computers. MacArthur uses these tools to help students engage with the rich and ever-growing archives of recorded poetry readings, available on PennSound or hosted on video sharing sites like YouTube. To get started using these tools, visit their homepages (click here to access Gentle’s homepage and here for Drift’s homepage) or check out the “Getting Started” guides on GitHub (click here for the guide on Gentle and here for the guide on Drift).
To run Gentle, upload an audio file of someone reading a poem, enter a transcript of the poem, then select “Align.” If you don’t have a transcript, you can upload the audio file alone, and Gentle will produce the text for you, although it is a little slow at this. In the alignment process, Gentle produces a data file (CSV or JSON) giving the duration of time for each word spoken and length of pauses between words. In each data file, the first column of numbers provides the duration of the word. The second column provides the length of time between that word and the next.
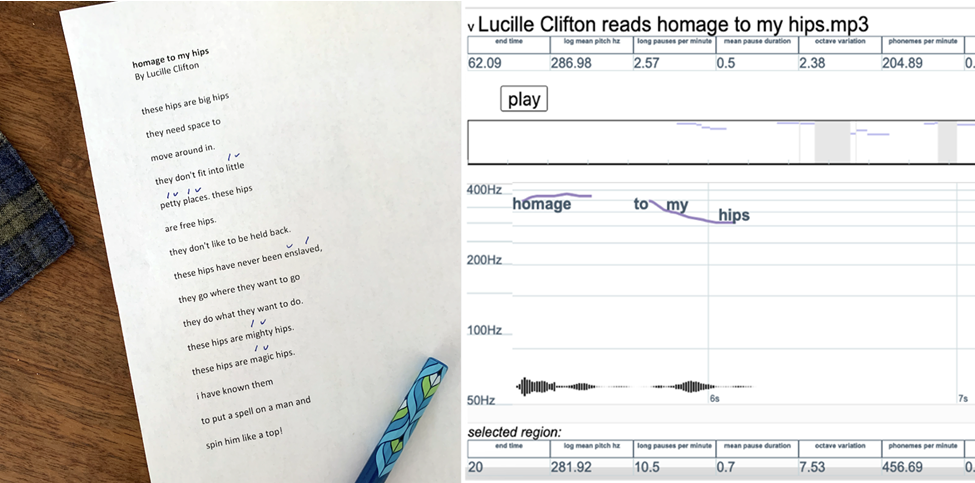
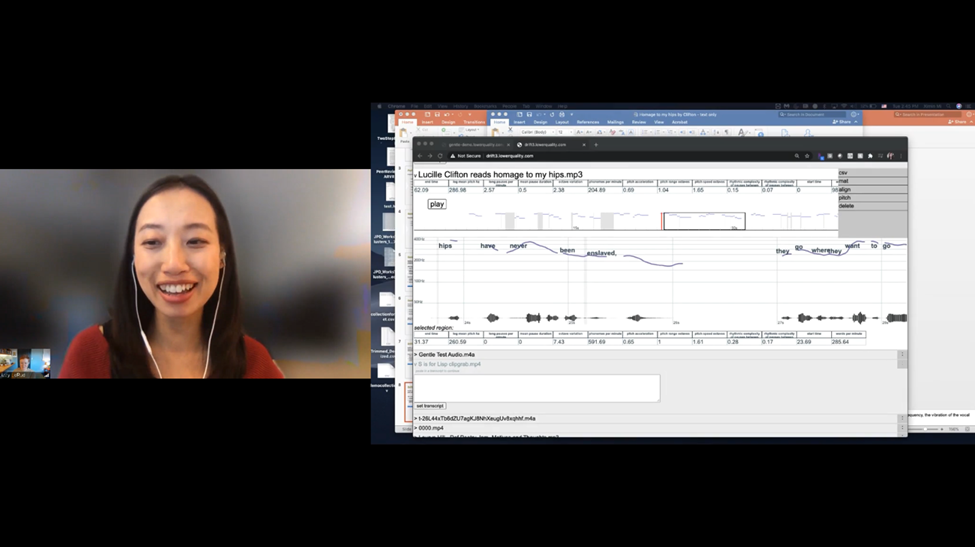
Drift works similarly: upload an audio file, enter its transcript, and let the software match the transcript with the recording. Drift will provide a range of data about the complete audio file, available in a bar at the top of the data set. Here’s a screenshot of the information Drift gives me when I input “homage to my hips” using this recording of Clifton reading the poem:
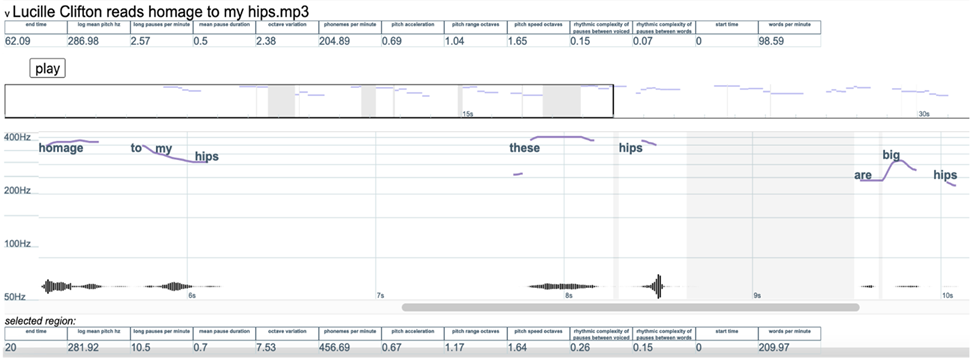
A screenshot showing part of Drift’s representation of “homage to my hips” by Lucille Clifton.
Drift helps us visualize patterns in Clifton’s loudness, measured in hertz, and it also provides data about her performed speech rhythms. Notice that we get a complete visual rendering of the pitch range for the poem: in the bar at the top, you’ll see phonemes per minute, words per minute, and information about pauses in her speech. Drift lets users select segments of the visualization, and the bar at the bottom of the data set gives information about that particular selection. Like Gentle, Drift produces a detailed data sheet showing the duration of each word in the poem, then further breaks that down by phoneme (shown below).
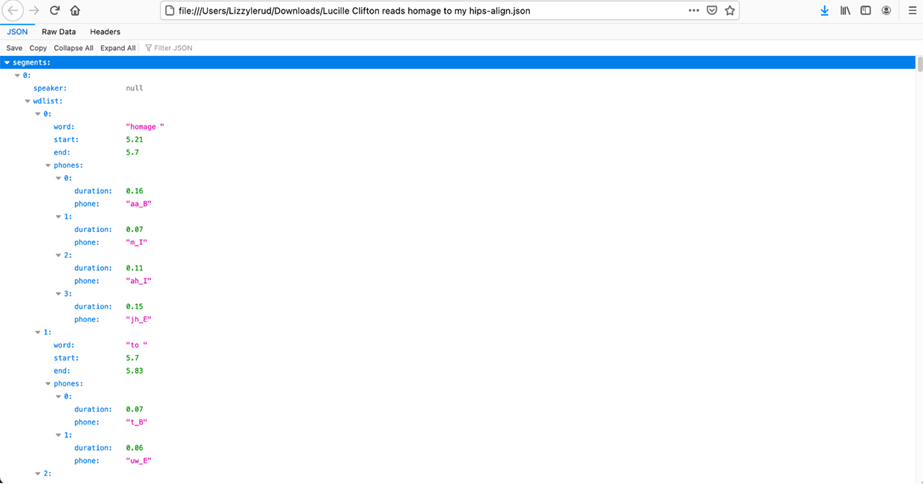
A JSON file produced by Drift showing the phonemic break-down of the word “homage.”
“A specific, human, readable format”: Poetry, Data Viz, and Georgia Tech
For Georgia Tech students—especially those majoring in engineering, computer science, and math—data visualization software feels concrete and therefore approachable in ways that other forms of literary analysis may not. Even for students who don’t resonate with numbers, these software tools invite playful exploration.
What better place to explore than the Data Viz Lab? In a post-pandemic world, my class would visit the lab in person, working with Data Visualization Librarian Ximin Mi to get started with Gentle and Drift. For my remote classes this spring, Mi graciously agreed to work with students in a video conference. Mi introduced these tools within the context of data visualization generally, explaining to students: “A bar chart, a pie chart, whatever: all of them take abstract information and put it in a specific, human, readable format. They help us find patterns and gain insight into the data we’re looking at. Then, you all get to come up with interesting questions to utilize and interpret the output that we get from both of the tools.”
Georgia Tech librarian Ximin Mi leading an online workshop on Gentle and Drift for my English 1102 course.
With Mi’s guidance, students conceptualize the distinction between gathering data about poems and interpreting it. They see that while Gentle will spit out whole lists of information, it’s up to us to figure out what to do with that information. And even though Gentle and Drift can do so much, it’s quickly apparent to students that this software is also limited. One must have or make an audio recording, for example; these tools don’t help us with text alone.
To build in critical assessment while we explore these tools, I ask questions that invite students to compare the limits evident in multiple methods for quantifying rhythms. For example, I might ask them to identify one element of speech rhythms that none of our tools can fully assess and to explain why they think that element shouldn’t be overlooked.
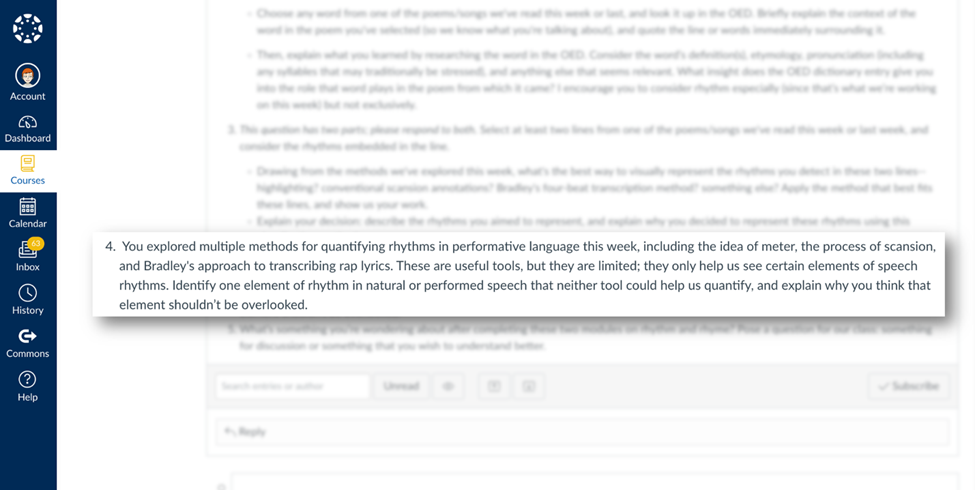
A sample discussion question inviting English 1102 students to assess multiple rhythm analysis tools.
In their responses, students may talk about the limitations of measuring loudness in hertz, or they talk about the aural qualities of a breath someone might take between words or sentences. Inevitably, someone points out that Gentle and Drift don’t help us recognize certain pronunciation patterns, a productive observation that takes us back to scansion and helps us see its value anew. These discussions show students that scanning for all those Greek meters is itself a data visualization tool, albeit an analog one. Like Gentle and Drift, it’s just another method for gathering data about a poem.
When our tools fail us, we can always invent new ones. In fact, I invite my students to do so with low-stakes activities, like when I ask them to choose their preferred method for representing the rhythms they detect in a chosen poem. “Explain your decision,” I ask them; “describe the rhythms you aimed to represent and explain why you decided to represent these rhythms using this visualization method.”
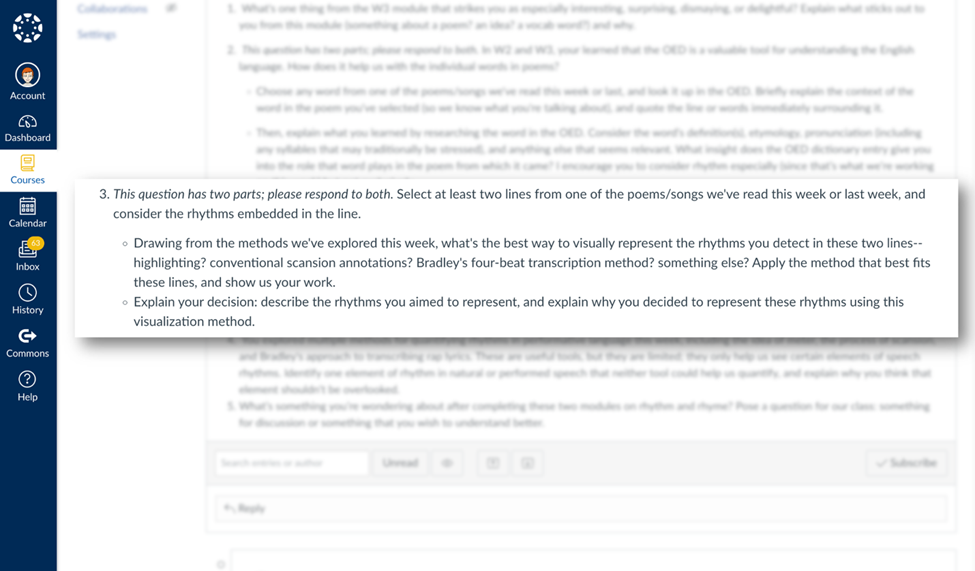
A discussion question that provokes students to invent their own analytical systems for representing rhythms.
Here are some examples of the work my students produced (shared with permission):
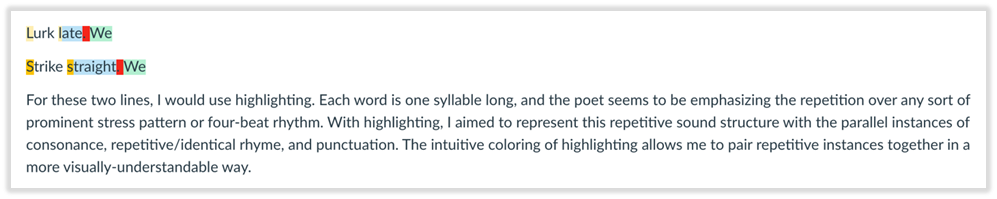
Michelle Shen’s analysis of sound patterns in Gwendolyn Brooks’s poem, “We Real Cool.”
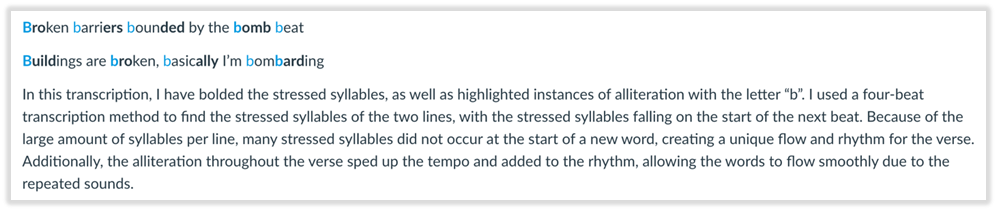
Noel Varughese’s analysis of two lines from Blackalicious’s “Alphabet Aerobics.”
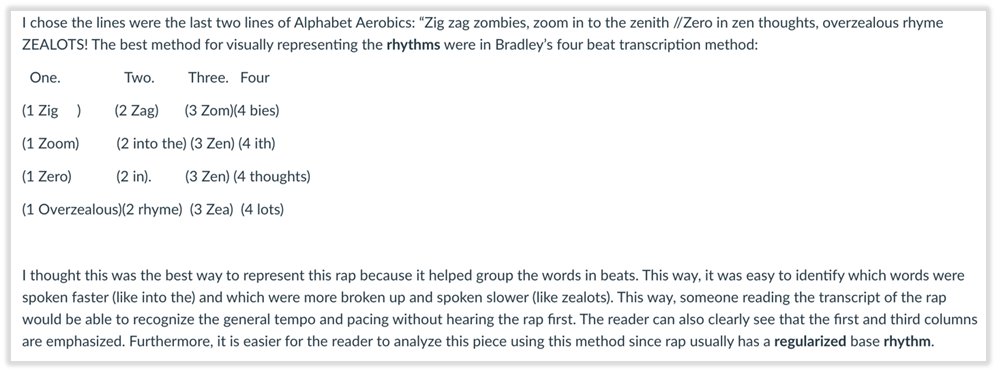
May Kalnik’s analysis of the last four lines in Blackalicious’s “Alphabet Aerobics.”
In each example, these students reveal the complexities of poetic sound patterns, accounting for syllabic patterns as well as a range of rhyming sounds and performative effects. They adapt elements of scansion, Gentle, Drift, and other methods we’ve explored to highlight rhythms characteristic of typical English phonemic patterns as well as spoken rhythms and emphases added by performers. These models help each student identify specific patterns and understand them better. Shen’s attention to the granular details of two lines helps her identify Brooks’s sentences as the rhythmic units in “We Real Cool,” for example, while both Kalnik and Varughese narrow in on deviations from the driving four-beat rhythm of “Alphabet Aerobics.” Notice how Kalnik’s grid shows us the beats built into “Alphabet Aerobics,” and by spacing and grouping syllables together, she also gives us a sense of how Gift of Gab emphasizes and elides certain sounds within that pattern, sounds which might not typically receive stress.
Empowering students to design their own data visualization systems for poetry helps them see how all such systems are likewise invented—including scansion, natural though it may seem, as well as Gentle, Drift, and other software. Drawing computerized methods into parity with analog ones shows students that all our systems of analysis have opportunities and limitations. It’s up to us to decide how to use them.
Notes:
I am grateful to Ximin Mi and the Georgia Tech Library for extensive support that enabled me to introduce students to the methods explored in this essay. I am also pleased to thank May Kalnik, Ximin Mi, Michelle Shen, and Noel Varughese for permission to share their work.
If you are interested in other fascinating ways to teach poetry, consider reading about Rebekah Greene’s poetry machines or Nick Strum’s garbage poetry project.